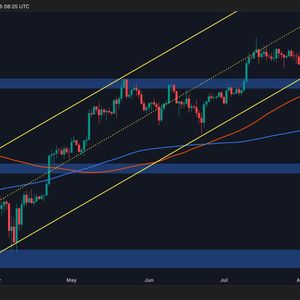
Bitcoin came under notable selling pressure following heightened geopolitical concerns stemming from the escalating conflict between Russia and the United States over nuclear threats. Despite the bearish momentum, the cryptocurrency has now reached a key support zone, expected to hold in the short term. Technical Analysis By ShayanMarkets The Daily Chart After a prolonged consolidation within the $116K–$123K range, BTC encountered heavy selling pressure, driven by escalating concerns over the Russia–US nuclear conflict. This led to a breakdown below the critical $114K support, sparking fear and uncertainty in the market. However, BTC has now approached a major support zone between $111K and $112K, an area defined by the lower boundary of a multi-month ascending channel and a key previous swing high. This confluence of technical support is likely to attract patient buyers, potentially initiating a bullish consolidation phase. Still, if the price fails to hold above this region, a rapid decline toward the psychological $100K level could follow. The 4-Hour Chart On the lower timeframe, Bitcoin’s breakdown from the bullish flag pattern marks a bearish technical signal, confirming the pattern’s failure. The sharp rejection from the flag’s upper boundary triggered a steep decline, bringing the price to a critical support near the $112K zone, which also aligns with the 0.618 Fibonacci retracement level. This particular one often acts as a magnet for short-term bullish reactions. As long as the price holds above this range, a corrective bounce is likely. However, if bearish momentum persists, another sell-off targeting a sweep below $111K–$112K may occur. Until then, short-term consolidation remains the most probable outcome. On-chain Analysis By ShayanMarkets The Exchange Netflow indicator shows that 16,417 BTC flowed into exchanges yesterday, the highest daily net inflow since mid-July. This suggests a significant number of holders are moving their Bitcoin to exchanges, typically a precursor to selling activity. At the same time, the Exchange Whale Ratio surged above 0.70, indicating that the majority of these deposits came from large holders (whales). Historically, when whale-dominated inflows coincide with elevated exchange activity, the market often faces increased selling pressure and price declines. If this trend continues and whales persist in depositing BTC at this pace, further downside risk could follow. Such activity may reflect profit-taking, preparation for a correction, or strategic reallocation in anticipation of near-term volatility. The post Bitcoin Price Analysis: $100K Breakdown Looms for BTC if This Support Fails appeared first on CryptoPotato .


