Marktkapitalisierung
24h Vol
10071
Kryptowährungen
58.26%
Bitcoin Aktie

Bitcoin Price Analysis: BTC Troubles Just Getting Started After 3% Daily Decline?

Bitcoin Price Analysis: BTC Troubles Just Getting Started After 3% Daily Decline?


Crypto Potato
2025-08-01 13:16:01

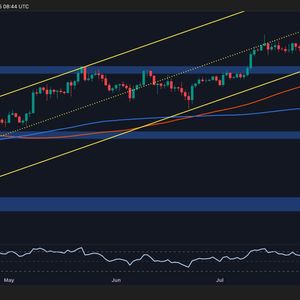
Bitcoin is showing clear signs of weakness, with increasing selling pressure driving the price lower. The asset has now approached a decisive multi-month support zone, with a confirmed breakdown triggering a sharp decline toward the $111K threshold. Technical Analysis By ShayanMarkets The Daily Chart After an extended period of sideways movement within the $116K to $123K range, Bitcoin has now turned downward, breaching the lower threshold. This drop signals a rise in distribution and selling interest, with the asset now testing a major support near $114K, coinciding with the lower boundary of its long-standing price channel. This region marks a critical battleground between buyers and sellers. A break below this level would likely trigger a new wave of sell orders, setting the stage for a deeper correction toward the $111K zone. The reaction at this pivotal level is expected to play a key role in shaping Bitcoin’s mid-term trajectory. The 4-Hour Chart Zooming in, the price was recently rejected from the upper boundary of a rising flag near $118K, signaling strong selling pressure. The recent drop has taken Bitcoin back toward the lower end of the flag structure, around $114K, which also aligns with the 0.5 Fibonacci retracement level. This confluence creates a strong area of support. A confirmed break below this level could lead to a long-squeeze scenario, pushing the price even lower. However, if demand picks up and buyers regain control, a bounce toward the $118K zone remains possible in the short term. On-chain Analysis By ShayanMarkets The Binance BTC/USDT liquidation heatmap highlights a tense standoff within the current market structure, with Bitcoin’s price caught between two significant liquidity pockets, one concentrated above the $120K level and another below $114K. These zones mark areas of high leveraged exposure, making them key magnets for institutional players and liquidity-driven moves. As the price hovers near the $114K threshold, the probability of a downward breakout increases. A drop below this level could trigger a chain reaction of stop-outs and liquidations, driving sharp downside momentum. Traders should monitor these zones closely, as any decisive move could unleash rapid and volatile price swings. The post Bitcoin Price Analysis: BTC Troubles Just Getting Started After 3% Daily Decline? appeared first on CryptoPotato .


Lesen Sie den Haftungsausschluss : Alle hierin bereitgestellten Inhalte unserer Website, Hyperlinks, zugehörige Anwendungen, Foren, Blogs, Social-Media-Konten und andere Plattformen („Website“) dienen ausschließlich Ihrer allgemeinen Information und werden aus Quellen Dritter bezogen. Wir geben keinerlei Garantien in Bezug auf unseren Inhalt, einschließlich, aber nicht beschränkt auf Genauigkeit und Aktualität. Kein Teil der Inhalte, die wir zur Verfügung stellen, stellt Finanzberatung, Rechtsberatung oder eine andere Form der Beratung dar, die für Ihr spezifisches Vertrauen zu irgendeinem Zweck bestimmt ist. Die Verwendung oder das Vertrauen in unsere Inhalte erfolgt ausschließlich auf eigenes Risiko und Ermessen. Sie sollten Ihre eigenen Untersuchungen durchführen, unsere Inhalte prüfen, analysieren und überprüfen, bevor Sie sich darauf verlassen. Der Handel ist eine sehr riskante Aktivität, die zu erheblichen Verlusten führen kann. Konsultieren Sie daher Ihren Finanzberater, bevor Sie eine Entscheidung treffen. Kein Inhalt unserer Website ist als Aufforderung oder Angebot zu verstehen