Рейтинг Рынка
24ч
10071
Активные криптовалюты
58.26%
Bitcoin Поделиться

Bitcoin Price Analysis: BTC Troubles Just Getting Started After 3% Daily Decline?

Bitcoin Price Analysis: BTC Troubles Just Getting Started After 3% Daily Decline?


Crypto Potato
2025-08-01 13:16:01

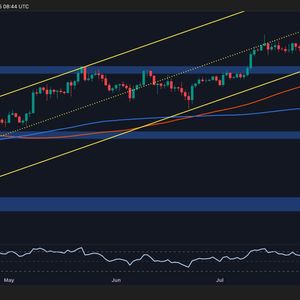
Bitcoin is showing clear signs of weakness, with increasing selling pressure driving the price lower. The asset has now approached a decisive multi-month support zone, with a confirmed breakdown triggering a sharp decline toward the $111K threshold. Technical Analysis By ShayanMarkets The Daily Chart After an extended period of sideways movement within the $116K to $123K range, Bitcoin has now turned downward, breaching the lower threshold. This drop signals a rise in distribution and selling interest, with the asset now testing a major support near $114K, coinciding with the lower boundary of its long-standing price channel. This region marks a critical battleground between buyers and sellers. A break below this level would likely trigger a new wave of sell orders, setting the stage for a deeper correction toward the $111K zone. The reaction at this pivotal level is expected to play a key role in shaping Bitcoin’s mid-term trajectory. The 4-Hour Chart Zooming in, the price was recently rejected from the upper boundary of a rising flag near $118K, signaling strong selling pressure. The recent drop has taken Bitcoin back toward the lower end of the flag structure, around $114K, which also aligns with the 0.5 Fibonacci retracement level. This confluence creates a strong area of support. A confirmed break below this level could lead to a long-squeeze scenario, pushing the price even lower. However, if demand picks up and buyers regain control, a bounce toward the $118K zone remains possible in the short term. On-chain Analysis By ShayanMarkets The Binance BTC/USDT liquidation heatmap highlights a tense standoff within the current market structure, with Bitcoin’s price caught between two significant liquidity pockets, one concentrated above the $120K level and another below $114K. These zones mark areas of high leveraged exposure, making them key magnets for institutional players and liquidity-driven moves. As the price hovers near the $114K threshold, the probability of a downward breakout increases. A drop below this level could trigger a chain reaction of stop-outs and liquidations, driving sharp downside momentum. Traders should monitor these zones closely, as any decisive move could unleash rapid and volatile price swings. The post Bitcoin Price Analysis: BTC Troubles Just Getting Started After 3% Daily Decline? appeared first on CryptoPotato .


Прочтите Отказ от ответственности : Весь контент, представленный на нашем сайте, гиперссылки, связанные приложения, форумы, блоги, учетные записи социальных сетей и другие платформы («Сайт») предназначен только для вашей общей информации, приобретенной у сторонних источников. Мы не предоставляем никаких гарантий в отношении нашего контента, включая, но не ограничиваясь, точность и обновление. Никакая часть содержания, которое мы предоставляем, представляет собой финансовый совет, юридическую консультацию или любую другую форму совета, предназначенную для вашей конкретной опоры для любых целей. Любое использование или доверие к нашему контенту осуществляется исключительно на свой страх и риск. Вы должны провести собственное исследование, просмотреть, проанализировать и проверить наш контент, прежде чем полагаться на них. Торговля - очень рискованная деятельность, которая может привести к серьезным потерям, поэтому проконсультируйтесь с вашим финансовым консультантом, прежде чем принимать какие-либо решения. Никакое содержание на нашем Сайте не предназначено для запроса или предложения