Mercato
24h Vol
10071
Cryptocurrencies
58.26%
Bitcoin Condividere

ATOM Rallies 2% on Bullish Breakout Amid Market Volatility

ATOM Rallies 2% on Bullish Breakout Amid Market Volatility


CoinDesk
2025-08-04 15:47:56

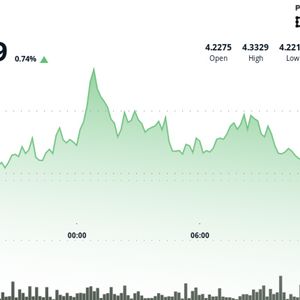
ATOM oscillated within a $0.12 corridor between $4.22 and $4.33—a 3% range that reflects the coin’s strategic positioning amid macro headwinds. Despite intraday volatility, price action was largely constructive, with bulls staging a breakout near midnight UTC on 4 August that pushed the token to a session high of $4.33. The rally was underpinned by heavy trading volume, peaking at 723,991 units during the upward surge, before facing resistance at the newly formed high. A reliable support floor solidified at $4.26 after multiple successful tests throughout the session. Meanwhile, the $4.29–$4.30 range emerged as immediate overhead resistance, suggesting a short-term consolidation channel is forming. Intraday Snapshot: Fast Gains in Final Hour The most dramatic price movement came within a one-hour window between 13:08 and 14:07 UTC on 4 August. ATOM initially consolidated in the $4.26–$4.27 band before triggering a breakout at 13:35. The move pushed the price up to $4.29 with intraday gains of 1%. Volume spiked past 288,000 units during this rapid ascent, indicating a robust inflow of momentum-driven buying. By the end of the hour, ATOM had stabilized in the $4.28–$4.29 range, as volume tapered off but price held near local highs—signaling buyer conviction and reduced profit-taking pressure. Technical Analysis: Bullish Indicators in Focus Breakout Confirmation : Strong upward move from $4.28 to $4.33 during high-volume spike (723,991 units), signaling breakout with conviction. Support Formation : $4.26 tested multiple times and held, reinforcing as critical near-term support level. Resistance Band : $4.29–$4.30 now acting as short-term ceiling, potential pivot zone for next leg. Volume-Led Rally : Over 288,000 units exchanged during 13:37 breakout confirms institutional or momentum trader activity. Two-Phase Structure : Initial consolidation phase followed by sharp breakout and stabilization indicates potential continuation pattern. Disclaimer: Parts of this article were generated with the assistance from AI tools and reviewed by our editorial team to ensure accuracy and adherence to our standards . For more information, see CoinDesk's full AI Policy .


Leggi la dichiarazione di non responsabilità : Tutti i contenuti forniti nel nostro sito Web, i siti con collegamento ipertestuale, le applicazioni associate, i forum, i blog, gli account dei social media e altre piattaforme ("Sito") sono solo per le vostre informazioni generali, procurati da fonti di terze parti. Non rilasciamo alcuna garanzia di alcun tipo in relazione al nostro contenuto, incluso ma non limitato a accuratezza e aggiornamento. Nessuna parte del contenuto che forniamo costituisce consulenza finanziaria, consulenza legale o qualsiasi altra forma di consulenza intesa per la vostra specifica dipendenza per qualsiasi scopo. Qualsiasi uso o affidamento sui nostri contenuti è esclusivamente a proprio rischio e discrezione. Devi condurre la tua ricerca, rivedere, analizzare e verificare i nostri contenuti prima di fare affidamento su di essi. Il trading è un'attività altamente rischiosa che può portare a perdite importanti, pertanto si prega di consultare il proprio consulente finanziario prima di prendere qualsiasi decisione. Nessun contenuto sul nostro sito è pensato per essere una sollecitazione o un'offerta