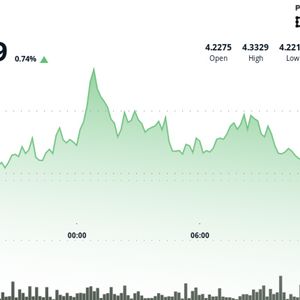
ATOM oscillated within a $0.12 corridor between $4.22 and $4.33—a 3% range that reflects the coin’s strategic positioning amid macro headwinds. Despite intraday volatility, price action was largely constructive, with bulls staging a breakout near midnight UTC on 4 August that pushed the token to a session high of $4.33. The rally was underpinned by heavy trading volume, peaking at 723,991 units during the upward surge, before facing resistance at the newly formed high. A reliable support floor solidified at $4.26 after multiple successful tests throughout the session. Meanwhile, the $4.29–$4.30 range emerged as immediate overhead resistance, suggesting a short-term consolidation channel is forming. Intraday Snapshot: Fast Gains in Final Hour The most dramatic price movement came within a one-hour window between 13:08 and 14:07 UTC on 4 August. ATOM initially consolidated in the $4.26–$4.27 band before triggering a breakout at 13:35. The move pushed the price up to $4.29 with intraday gains of 1%. Volume spiked past 288,000 units during this rapid ascent, indicating a robust inflow of momentum-driven buying. By the end of the hour, ATOM had stabilized in the $4.28–$4.29 range, as volume tapered off but price held near local highs—signaling buyer conviction and reduced profit-taking pressure. Technical Analysis: Bullish Indicators in Focus Breakout Confirmation : Strong upward move from $4.28 to $4.33 during high-volume spike (723,991 units), signaling breakout with conviction. Support Formation : $4.26 tested multiple times and held, reinforcing as critical near-term support level. Resistance Band : $4.29–$4.30 now acting as short-term ceiling, potential pivot zone for next leg. Volume-Led Rally : Over 288,000 units exchanged during 13:37 breakout confirms institutional or momentum trader activity. Two-Phase Structure : Initial consolidation phase followed by sharp breakout and stabilization indicates potential continuation pattern. Disclaimer: Parts of this article were generated with the assistance from AI tools and reviewed by our editorial team to ensure accuracy and adherence to our standards . For more information, see CoinDesk's full AI Policy .


